Explore sustainability features of IBM’s Envizi Software with its free 14-day trial. Like IBM’s free 14-day trial of Maximo Application Suite (MAS), the Envizi trial provides hands-on access to it’s wide range of feature sets.
To sign up for the trial, access this url and follow the prompts to sign up for the trial. IBM will then share a cloud-hosted trial version of Envizi with you. To assist your exploration of Envizi, here are 14 tips on how to get started with the trial:
1. Navigate the Envizi Home Page
This is the beginning of your Envizi trial. The home page offers access to different dashboards and reports, and information on your trial. To return to this page at any time, click on the ‘Envizi’ text at the top left-hand banner.

2. Open the ‘Please Read’ Section.
The please read section offers an excellent link to recommendations on getting started with the trial from IBM. Be sure to bookmark this link at: https://www.ibm.com/products/envizi/resources/getting-started
3. Dive into Data Foundation.
Click the blue, circular icon on the top left of the screen to open the data foundation structure. This provides an organizational hierarchy categorized by Locations, Classifications and Portfolio groups.

4. Understand Hierarchical Structure.
 Locations: Identify an Organization’s buildings, properties, assets, or sites within an Organization.
Groups: Collections of Locations.
Classification Groups: Represent the organization’s structure which is used throughout Envizi Reports and Dashboards. Locations must be in a Classification group to be included in Reports and Dashboards.

Portfolio Groups: Secondary reporting structures. Locations may or may not belong to Portfolio Groups.
5. Familiarize Yourself with the Icons.
Icons are used within the data hierarchy to indicate a records categorization. These icons include:

Locations

Classification Groups

Portfolio Groups
6. Review Detailed Records.
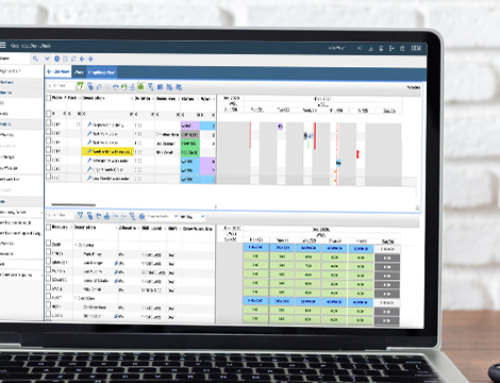
Access details on a Location, Group, or Account by clicking on its blue hyperlinked text. As shown in the top left of the screen, the drilldown path in this example is Classification Groups – Suppliers – United States Suppliers – United States Suppliers – S3.1 – Air Transportation – USD or local.
This displays an account summary dashboard displaying actual, accrued, and estimated costs. Click on the Review Display to review monthly data or source records.

7. Wait Patiently.
Navigate back to the home page by clicking ‘Envizi’ in the top left-hand banner. Scroll down the home page to the ‘Power Reports’.
If you click on the reports when you first receive the trial, note no data appears. As noted in the ‘Please Read Section,’ you must wait 24 hours after you login to the Trial for data in the Power Reports to appear.

8. Know that the Wait is Worth it.
After waiting 24 hours, click on the ‘Account Data Health’ Power Report. The report opens in a separate browser session.
The Account Data Health Check report includes insights into your organization’s data activity and data gaps, which is key to ensuring your data foundation remains complete and accurate for reporting.

9. View Performance Across Key Environmental Indicators.
The Sustainability Executive Report provides visualizations on Emissions, Energy, Waste and Water. Select any of these critical categorizations to drill into the details data type, locations, and time periods. Interact with the data by applying filters to generate custom views.

10. Analyze Emissions.
The Scope 3 Emissions Analysis Power Report provides extensive views of emission data. To view content, update the reporting period to 2023 as highlighted by the green circle. Enable different data views by selecting from the wide range of data categorizations.

Additional details on this report can be found in this 5-minute video: https://knowledgebase.envizi.com/home/scope-3-emissions-summary-powerreport
11. Understand Data Health.
Data entered in Envizi is either actual, estimated, or accrued. Accrued data are system-generated estimates for missing consumption and/or cost data in Accounts. (e.g., Missing Invoices). Envizi provides multiple views of data health, along with reports (Accounts Incomplete Data report, Monthly Data Summary Report) for monitoring data quality.

12. Continue Analyzing Data with the Emissions Performance Dashboard.
Navigate back to the home page to review the Emissions Performance dashboard. Use the filter on the far right-hand side to view the data by Groups, Measures, Regions, or Locations.

Scroll down to view Emissions Inventory which can be expanded and exported for additional analysis.

13. Monitor Performance.
View your Organization’s Performance, or Performance by Data Type, Group, Scope, and more.

14. Connect with Maven’s Envizi Experts.
Reach out to Maven Asset Management’s team for assistance in answering your questions and understanding the value of Envizi.